How to start with Technical analysis
How to start with Technical analysis in stock trading or other financial markets, you need to understand key concepts such as charts, patterns, and indicators. This approach focuses on studying historical price movements to predict future trends. In this article, I’ll walk you through how to start with technical analysis, breaking down what it involves and how you can use it to improve your trading decisions.
How Can I Start with Technical Analysis?
If you’re asking, “How to start with technical analysis?” you’re already taking a step in the right direction. Technical analysis is widely used by traders to predict price movements based on historical data. Whether you’re new to the stock market or have been trading for a while, this method can help you make informed decisions without relying on the subjective side of company reports.
What is Technical Analysis?
Technical analysis is the study of historical price charts to forecast future price movements. Unlike fundamental analysis, which focuses on a company’s financials and intrinsic value, technical analysis relies solely on past price action and market trends. Whether you’re trading stocks, cryptocurrencies, or commodities, the principles remain the same.
With technical analysis, traders often look for trends, entry and exit points, and potential risks. It works on the assumption that price action reflects all relevant market data and that human psychology tends to repeat itself, causing price patterns to emerge. While it may sound complex at first, mastering the basics can help you make better trading decisions.
Why Start with Technical Analysis?

If you’re still wondering why technical analysis is worth your time, here are some compelling reasons:
- Simplicity: By focusing on price patterns and indicators, technical analysis simplifies market analysis.
- Speed: You can make decisions quickly without needing to wade through financial reports.
- Data-Driven: It’s based purely on data—no need to guess or speculate.
- Works in Any Market: Whether you’re trading stocks, forex, or crypto, technical analysis applies to all markets.
Step-by-Step Guide on How to Start with Technical Analysis
1. Learn to Read Price Charts
Price charts are the foundation of technical analysis. You need to know how to interpret them before diving deeper into technical indicators or patterns. There are three main types of charts you should get familiar with:
- Line Charts: These are the simplest type of chart, connecting the closing prices over a period with a line.
- Bar Charts: A bar chart gives more details, showing the opening, closing, high, and low prices for a specific time.
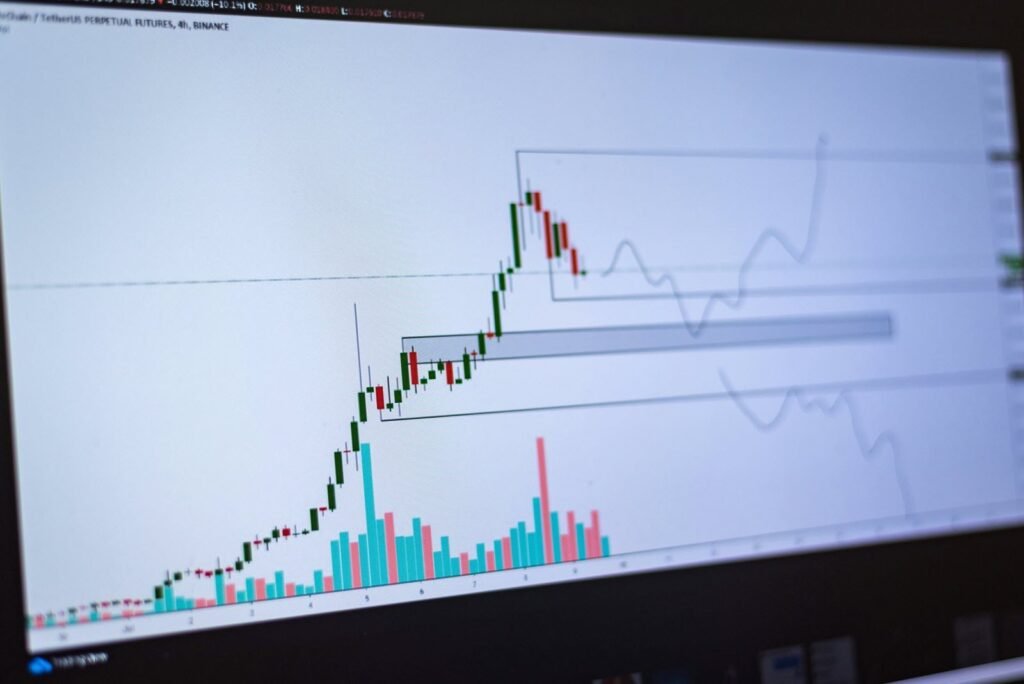
- Candlestick Charts: The most popular among traders. They visually show the open, high, low, and close prices for a period, and their unique shape helps predict trends. Patterns like Doji, Hammer, and Engulfing provide clues about possible market movements.
2. Understand Support and Resistance Levels
Support and resistance are crucial concepts in technical analysis. These levels mark areas where the price tends to stop falling (support) or stop rising (resistance).
- Support: This is the level at which buyers are expected to step in and buy, preventing the price from falling further.
- Resistance: This is where sellers tend to enter, preventing the price from rising higher.
When the price breaks above a resistance level or below a support level, it could signal the start of a new trend.
3. Learn About Technical Indicators
There are various technical indicators that can help you predict future price movements. Some of the most popular indicators include:
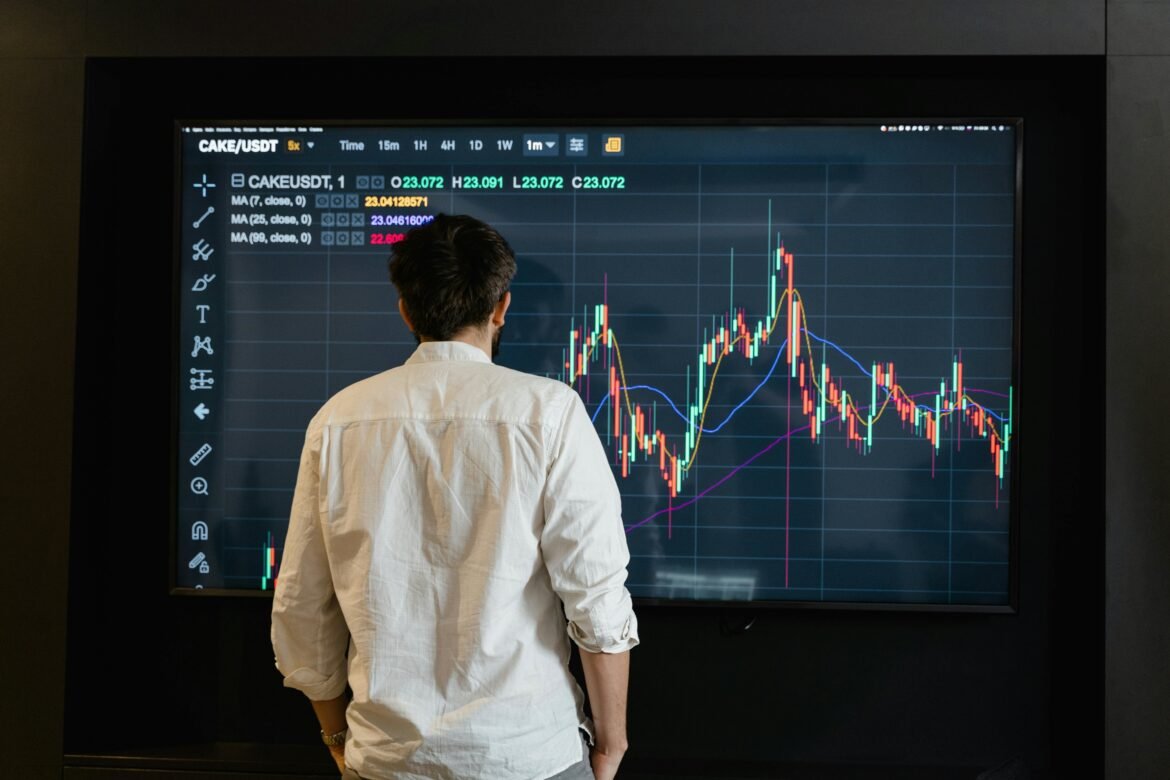
- Moving Averages: Moving averages help smooth out price data, making it easier to identify trends. The 50-day and 200-day moving averages are particularly common for spotting long-term and short-term trends.
- Relative Strength Index (RSI): This indicator measures whether a stock is overbought or oversold. If the RSI is above 70, the stock is considered overbought; below 30, it’s considered oversold.
- MACD (Moving Average Convergence Divergence): The MACD is a momentum indicator that helps identify bullish or bearish signals. It’s based on the relationship between two moving averages.
- Bollinger Bands: These bands measure market volatility. When the bands expand, the market is more volatile; when they contract, volatility decreases.
4. Understand Trendlines and Patterns

In technical analysis, identifying trendlines is a key skill. A trendline is a line drawn on a chart to show the general direction in which the price is moving.
- Uptrend: The price makes higher highs and higher lows, indicating bullish momentum.
- Downtrend: The price makes lower highs and lower lows, indicating bearish momentum.
- Sideways Trend: The price remains within a range with no clear direction.
In addition to trendlines, keep an eye out for common chart patterns such as:
- Head and Shoulders
- Double Tops and Bottoms
- Triangles (ascending, descending, and symmetrical)
- Flags and Pennants
These patterns help predict whether the current trend will continue or reverse.
Difference Between Technical and Fundamental Analysis
It’s important to understand how technical analysis differs from fundamental analysis. Here’s a quick breakdown:
Fundamental Analysis
- Focuses on a company’s financial health, including earnings, revenue, and debt.
- Aims to determine a company’s intrinsic value.
- Looks at external factors like management and industry trends.
Technical Analysis
- Focuses solely on price movements and trends.
- Assumes that all relevant information is already reflected in the price.
- Primarily used for short- to medium-term trading.
While fundamental analysis is better suited for long-term investing, technical analysis is favored by traders looking for short-term gains. In many cases, traders combine both methods for a more comprehensive view.
Why Millions of Investors Use Technical Analysis
You might wonder why technical analysis is so widely adopted. Let’s explore the reasons:
1. Speed and Simplicity
For many traders, technical analysis provides a quicker way to make decisions. You can scan charts and indicators to find opportunities without the need to read through financial statements or reports. This makes it a go-to method for day traders and swing traders.
2. Data-Driven
Technical analysis is entirely objective. It relies on price action, volume, and historical data, which reduces the chances of emotional bias creeping into your decisions. This data-driven approach allows you to focus on what the market is telling you, rather than what you think should happen.
3. Risk Management
By using stop-loss orders and identifying key levels of support and resistance, traders can manage their risk more effectively. Risk management is a crucial element of successful trading, and technical analysis helps you stay disciplined by sticking to a predefined plan.
4. Works Across Markets
One of the best things about technical analysis is that it’s universal. Whether you’re trading stocks, forex, commodities, or cryptocurrencies, the principles remain the same. This versatility is why millions of investors use it across different asset classes.
Tools to Get You Started with Technical Analysis
There are numerous tools available that make it easy to dive into technical analysis. Some of the best platforms to get started include:
- TradingView: This platform offers advanced charting tools and a user-friendly interface. It’s a favorite among beginners and experienced traders alike.
- Yahoo Finance: If you’re new to the game, Yahoo Finance is a great place to start. It offers free charting tools and basic technical indicators.
- StockCharts: For those who want more advanced features, StockCharts provides a wide range of chart types, indicators, and educational content.
- MetaTrader 4/5: A popular choice for forex and CFD traders, MetaTrader offers a wealth of technical indicators and customization options.
FAQs About How to Start with Technical Analysis
Q1: How Long Does it Take to Learn Technical Analysis?
The time it takes to learn technical analysis varies based on your commitment and previous experience. Beginners can expect to grasp the basics within a few months, but consistent practice and continuous learning are key to mastery.
Q2: Can I Combine Technical and Fundamental Analysis?
Yes! Many traders use a blend of both technical and fundamental analysis to get a fuller picture of the market. Technical analysis can help you time your trades, while fundamental analysis gives you insight into the long-term value of an asset.
Q3: Is Technical Analysis Useful for Long-Term Investors?
While technical analysis is commonly used by short-term traders, it can also benefit long-term investors. For example, identifying key levels and trends can help you make more informed entry and exit points, even for long-term positions.
Conclusion: How to start with Technical Analysis
Technical analysis is a powerful tool that traders at all levels can benefit from. By learning the basics like price charts, support and resistance, and technical indicators, you can start making more informed trading decisions.
While it may feel overwhelming at first, practice and patience will help you improve over time. Start with simple tools like moving averages and RSI, and gradually incorporate more advanced techniques like MACD and Bollinger Bands. Before you know it, you’ll be spotting trends, predicting price movements, and making trades with confidence.
Remember, technical analysis is just one piece of the puzzle, but when combined with sound risk management and continuous learning, it can greatly improve your chances of success in the markets.


