How to Read Forex Charts: A Step-by-Step Guide
Anyone just starting in the Forex market needs to know how to read Forex charts to succeed. Charts contain some of the most important information regarding prices in the forex market and assist traders in their work. At first, they may seem scary, but once you comprehend their basics, you will see that they are awesome weapons in your trader’s toolbox. In this simple guide, you will learn how to read Forex charts, decode major elements, and how they can be used to trade correctly.
Understanding Forex Charts
A Forex chart might be described as an organized visual display of the fluctuating prices of currencies about one another. Originally, line charts, bar charts, and candle stick charts were the most frequently used chart types in Forex marketing. Like most charts, each type uniquely gives price data while containing valuable information that traders use to evaluate trends and search for trading opportunities. This is particularly so for a beginner so that he or she has an idea of each chart in terms of the price data it depicts.

Choosing the Right Timeframe for Forex Charts
This simply means that having read the Forex charts, one of the best decisions that need to be made is the choice of the proper time frame. The available groupings of forex charts can be monthly, weekly, daily, 60 minutes, 15 minutes, 5 minutes, 1 minute, and 1 day. The duration you select depends on the trading plan you have adopted. Respective scalpers and day traders prefer 1-minute and 5-minute charts, whereas swing traders prefer daily or weekly charts, on average. Learning how one forms views on price patterns based on the movement’s momentum in the time horizon one chooses is crucial.
Line Charts: The Simplest Forex Chart
A line chart is the simplest kind of Forex chart type that Forex investors can use. It is in the form of a line that shows the closing prices of a specific currency pair over a given time interval. Line graphs are simple, easily understandable, and most frequently used to determine market trends. While not as detailed as bar or candlestick charts, line charts are perfect for newcomers because they present trends well but avoid overwhelming a trader with too much information.
Bar Charts: Offering More Detail
Bar charts show even more elaborated information than line charts. Every bar in a bar chart reflects a particular period and gives that period’s opening, closing, highest, and lowest prices. The top mark on the outside of the vertical line represents the highest price, and the bottom represents the lowest price. The straight lines parallel on the left and right show the opening and closure of the prices. Newsletters discourage long trading during the day as bar charts can easily identify price swings.
Candlestick Charts: A Favorite Among Traders
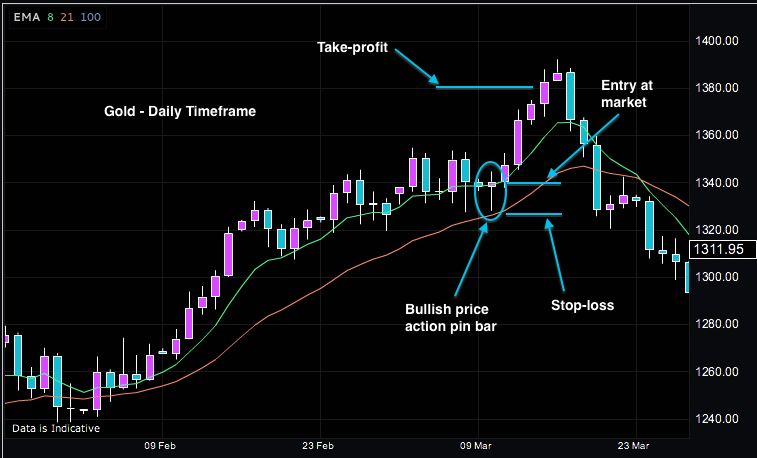
The most common Forex chart encountered by traders is the candlestick chart because it presents a wealth of information in a simple form. There are several lessons to learn in this kind of chart: Each is called a ‘candlestick,’ and each represents an agreed period; it depicts the opens, closes, highs, and lows of pairs of currencies. Candlesticks consist of two parts: the body and the wick. The body is the area between the opening and closing prices, and the wick defines the high and low prices. Since trend analysis is an important part of trading, candlestick charts are very effective, specifically in this context.
Reading Candlestick Patterns
The application of candlestick charts helps identify candlestick patterns, which is one of the conveniences of the tool. These patterns give clues to the current state of market sentiment and possible future price changes. Some well-known patterns found in candlestick analysis are the doji, hammer, and engulfing patterns. Such a pattern as a hammer suggests a reversal at the end of the selling or bearish phase, whereas the engulfing pattern could also show a continuation of the current trend. This is how the patterns appear, and it is crucial for any trader who wishes to make better decisions based on the movement of the series.

Identifying Support and Resistance Levels
Technical levels such as support and resistance are important concepts in Forex trading, and as mentioned earlier, these levels can be perfectly viewed on Forex charts. Demand is the price level that currency pairs attract buyers to, thus halting the pair’s decline. On the other hand, resistance is the scenario in which selling interest uncouples the price. The advantage of these levels is that traders use them to define the points of entry and exit in the trade. Another important thing that can be learned by looking at Forex charts is identifying and applying dynamic support and resistance levels while opening positions.
Trend Lines and Their Importance
Technical analysis trends are among the most elementary concepts but are important in analysis. The trend line can be drawn by joining two or more prices on any chart. When the price increases, the trend line is drawn below the price as a support line. During a bearish market, the trend line is drawn above the price, acting as a resistance line. Trend lines act as a director to the market with the knowledge that whenever the trend line is violated, it gives hints of a reversal. One of the key concepts in the determination of Forex charts is trend lines.
Moving Averages as a Tool for Identifying Trends
Moving averages are one of the standard tools of Forex charts that make it easier to work with the price data in question and determine trends. The moving average is obtained when the closing price of a currency/ pair is averaged over a given period- 10 Days or 50 Days. There are two primary kinds of moving average formulas: Simple Moving Average SMA and Exponential Moving Average SMA. They can benefit traders in how trends can be seen and potential reversal points to average trading signals. When trained to read moving averages, one can be in a position to make the right choices in trading.
Using Fibonacci Retracement Levels
Some traders use other types of retracement levels known as the Fibonacci retracement levels. These levels are arrived at by assuming two points on the Forex chart at the highest and lowest levels and then decomposing the vertical distance in the ratios, including 23.6 percent, 38.2 percent, 50 percent, 61.8 percent, and 100 percent, respectively. Fibonacci retracement meanders help traders understand how far a price will pull back before correcting itself and continuing in its direction. That is why including Fibonacci retracement levels in your trading strategy will assist in finding better points of entry and exit of trades.
Understanding Chart Patterns
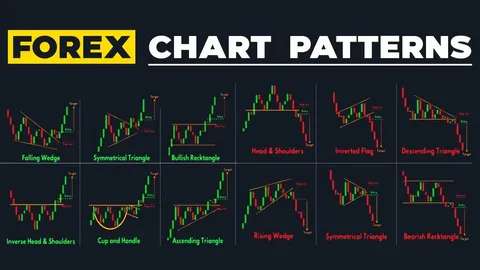
Another crucial element in trying to read Forex charts is chart patterns. These patterns emerge when the price of a currency pair aligns itself into certain shapes on a chart, such as triangles, heads and shoulders, and flags. Each of them has its consequences for future price changes. For instance, a head and shoulders formation usually predicts a reversal pattern and a flag formation indicates a continuance pattern. It will be important for any trader to master the different chart patterns since it enlightens the trader with the necessary information about the market’s direction.
Relative Strength Index (RSI) and Momentum Indicators
There are oscillating indicators used to help the Forex trader in his/her trading; one of them is the Relative Strength Index (RSI). The RSI quantifies the velocity of the price change and is also represented on an arithmetic scale from 0 to 100. When the RSI is above 70, the market is thought to be overbought, and the reverse is very likely to happen. The market condition is oversold when the RSI is below 30, and there is room for an uptrend. RSI, alongside other momentum indicators, can help a trader understand market conditions with a view of when to enter a trade.
The Importance of Volume in Forex Charts
Volume relates to the turnover frequency within a particular period, thus being a key fundamental factor for traders. In Forex trading, volume is also applied with trends to confirm or to look for a reversal signal. For instance, when assessing the strength of the upward price movement accompanied by the strengthening of the volumes, there is intensive buying pressure. On the other hand, if the price is above and volume is moving down, it may be a sign that the trend is slowing down. If you take the time to read the volume of Forex charts, then you will be in a better position to make the right trading decisions.
Conclusion
For beginners, it is always confusing to read Forex charts, but once a trader learns how to read them, it becomes a very helpful tool in trading. With such knowledge about the kinds of charts, recognizing patterns, and following technical indicators such as the moving average and Fibonacci retracement level, you can see much deeper into the market and develop better trading strategies. Interpreting Forex charts would enable you to discover the direction of the trend, probable trend reversal, and other significant aspects of the market, thus increasing success rates in Forex markets.


