

Understanding P/E Ratios and Other Stock Metrics
Share trading involves evaluating stocks by reference to several ratios that may assist in determining their value. A good pricing tool known as the Price-to-Earnings (P/E) ratio helps reveal a particular stock’s price about its earnings. Various important parameters apply to stocks to better understand stock investing. Appreciation of these financial measures can assist investors in evaluating stock market performance and making appropriate decisions.
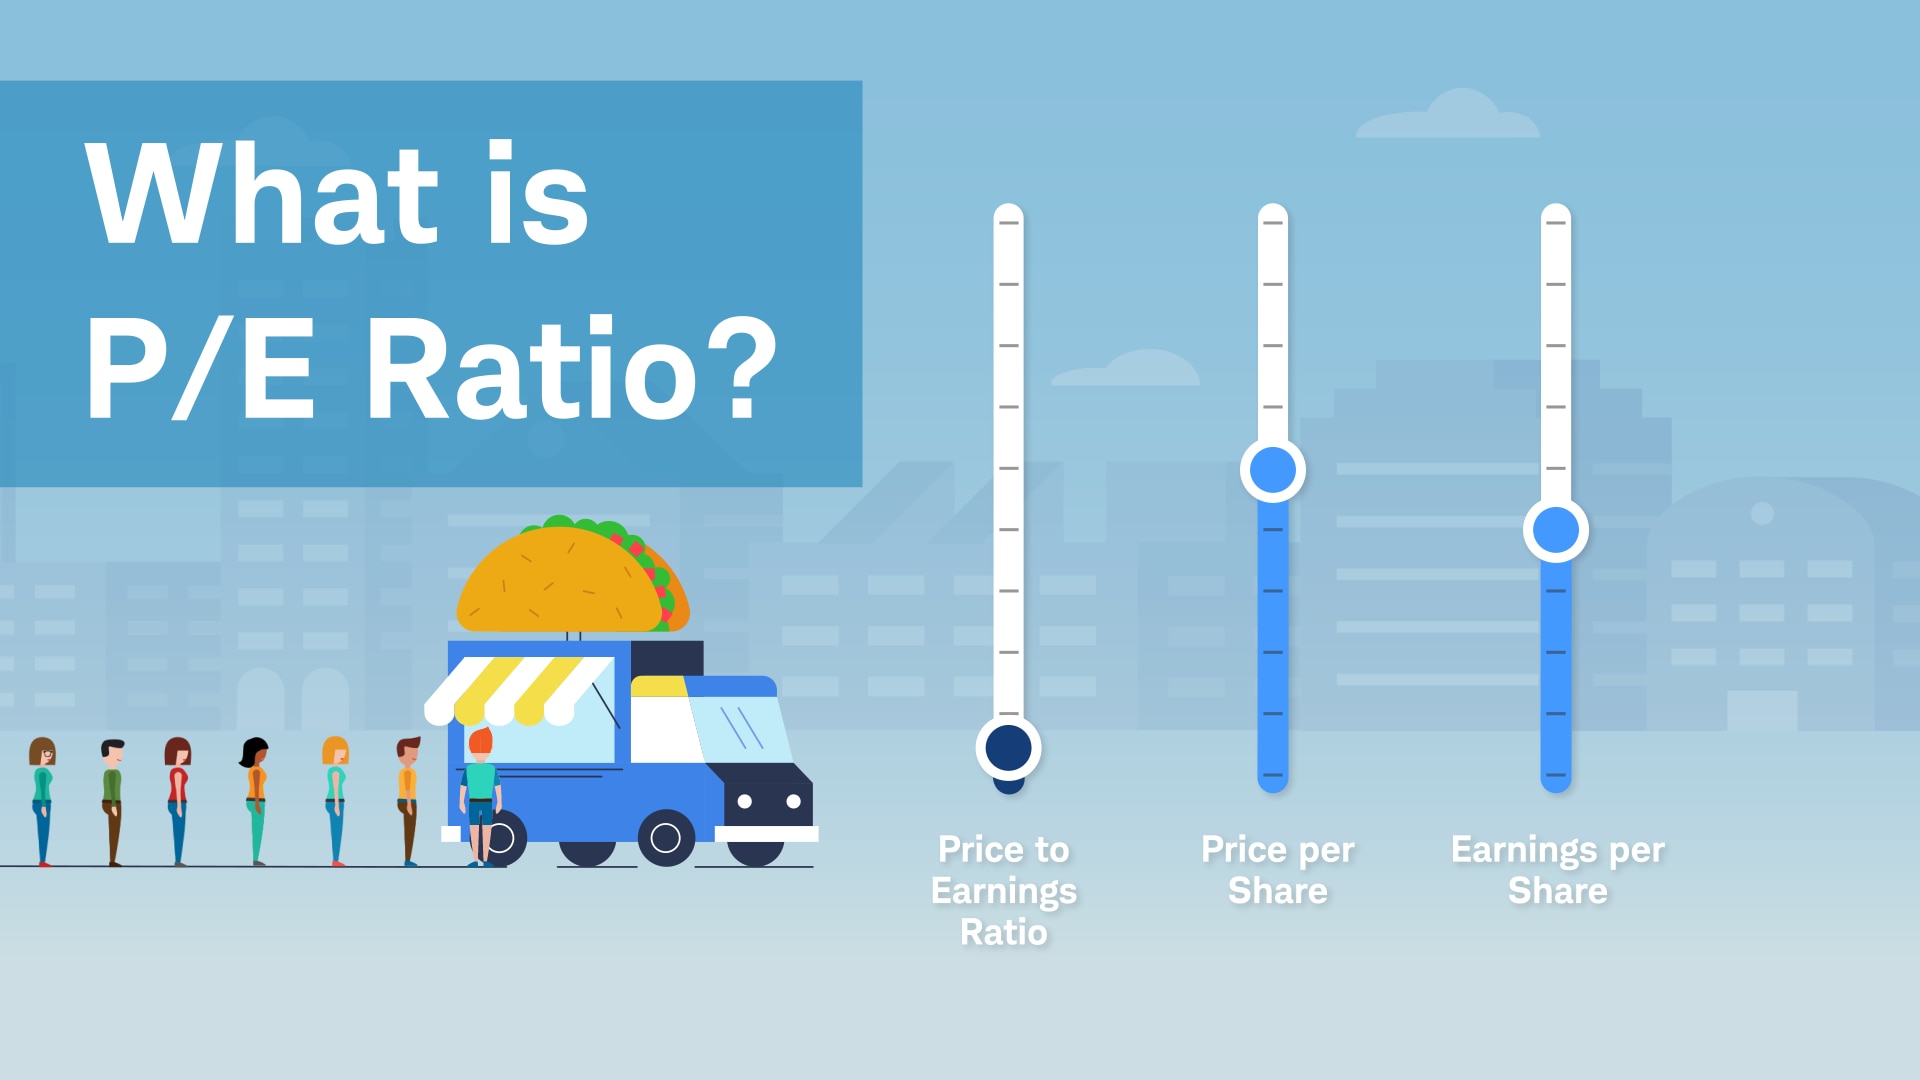
What is a P/E Ratio?
P/E is an abbreviation for Price-to-earnings ratio, and it is arrived at by a simple division of the price per share by the Earnings per share. This metric assists investor in knowing the amount that they are willing to pay for a dollar of earnings made by any given firm. Hence, the business adopting a high P/E ratio may be considered overpriced, while a low P/E ratio may be deemed undervalued. Specifically, the P/E ratio can help a person determine the fairness of the price to earnings relative to the bearing of the company’s stock.
How to Calculate P/E Ratio
It is relatively easier to determine the P/E ratio for any company as it only involves the ratio of the stock’s price per share to the earnings per share. It is calculated using the P/E ratio formula, in which the market price per share is divided by the earnings per share. For example, it involves one company whereby you have your share price at $100 and your earnings per share at $ 5, then that company has a P/E of 20. This means that investors are willing to pay 20 times the company’s earnings at this company’s stock. By understanding how to compute the P/E ratio, one can assess various stocks and make good decisions on which stock is fairly priced or over or underpriced.
Types of P/E Ratios
The two traditional classifications of the P/E ratios are trailing P/E and forward P/E. The trailing P/E ratio reflects the price-earnings ratio from the last four solo figures, while the Forward P/E ratio is the price-earnings ratio of the following twelve projected figures. Considering the two methods, forward PE can reveal possibilities concerning the company’s future, while trailing PE considers work results from the past period. Therefore, investors should consider both since it would give a better view of how a company is valued out of the stock.
What is a Good P/E Ratio?
In other words, it is impossible to point to a ‘right’ or ‘good’ P/E ratio, as this varies depending on the industry, the general climate and the potential for growth in the organization. This determines an acceptable value in the industry for use as a benchmark since different industries have different P/E ratios. A low P/E ratio may make the stock seem to have a lower valuation than before. Therefore, it may be undervalued, but intrinsic factors that might affect the company could also be an implication. On the other hand, a high P/E ratio might indicate future growth expectations by investors in the firm’s stocks. It is thus imperative to understand what should be considered decent P/E for each sector to make proper investment decisions for speculations or otherwise.
Limitations of P/E Ratios
Nevertheless, it is impossible to say that the indicator is perfect for analyzing investment opportunities, as it has certain drawbacks. The first disadvantage is that the growth rate is not brought into consideration. A stock with a high P/E ratio could appear overpriced, which is unnecessary since growth stocks keep commanding premium prices. Furthermore, this method of valuing the companies does not consider such parameters as debt level, which affects the company’s performance. Thus, the P, E ratio should be used with other tools to give an overall picture of a particular stock.

What is the PEG Ratio?
The PEG ratio is still a development of the P/E ratio, which goes by the full name of Price/Earnings to Growth ratio. It includes a company’s growth rate; thus, it is a better measure of stock value than using earnings per share or P/E ratio. The PEG ratio is a modified measure of the P/E ratio formula in which the P/E ratio is divided into the rate of earnings per share growth rate. PEG readings below 1 suggest that the stock may be undervalued, while ratios above 1 infer that the share is overvalued. Incorporating the fact that the growth rate gives one an insight into the progress of the company’s future performances, the PEG ratio gives a comprehensive view.
Earnings Per Share (EPS) and Its Importance
Earnings per Share (EPS) is another important financial ratio that depicts the proportion of every outstanding stock that belongs to the company. The rate is computed using the net income formula divided by the total number of shares in the company. EPS gives investors an insight into the profit level a business entity produces per its outstanding shares. Higher expectations and better EPS mean better profitability, and this is thus why investors use EPS to analyse stock market performance.
Dividend Yield and What It Tells Investors
The dividend yield is a financial ratio that presents the number of cash dividends a company pays in a given fiscal year in proportion to its stock price. Generally, it is determined by identifying the annual dividend payment by the current stock price. However, for income investors, yield is very significant because it shows how much return can be expected regarding dividends. Shares with high yields might appeal to those who want regular income, but investors should also consider whether the company will consistently sustain dividend payments.
Price-to-Book Ratio (P/B Ratio) and Its Use
The P/B ratio calculates the company’s market value with its book value, which is its total assets minus its liabilities. This ratio informs investors how much they will spend on the company’s assets. A lower P/B ratio is more applicable for a cheap firm and could be considered undervalued, while a high P/B ratio shows a stock is overvalued. Using the P/B ratio is particularly helpful when deciding on possible value stocks, especially in rightly chosen industries which involve tangible assets.
Debt-to-Equity Ratio and Its Significance
The D/E ratio reveals the debt position of a business based on the shareholders’ equity or the total amount of funds that belong to the business’s owners. It is arrived at using the total liabilities divided by the shareholder’s funds. That is why it is advisable to avoid companies with high D/E ratios, as their operations rely much on creditors, who are vulnerable during an economic downturn. The D/E ratio should be checked to know about the firm’s solvency and how well it maintains its debts.
Return on Equity (ROE) and Stock Performance
Return on Equity (ROE) is an evaluation formula that tells the profit a company brings against the shareholders’ funds. It is worked out as net income by Shareholders’ equity. This implies that a higher ROE shows that the firm is capitalizing on its equity efficiently to generate profit. That is why ROE is one of the most valuable for analyzing a company’s financial performance indicators. It can be used to compare various companies from the same sector to determine the level of profitability.
Price-to-Sales Ratio (P/S Ratio) and When to Use It
The Price-to-Sales (P/S) ratio compares a company’s market capitalization to its total revenue. It is expressed by dividing the price of stock by revenue per share. The P/S ratio is very valuable when applied to companies that are not yet making profits but have high revenues. A P/S ratio lower than the industry average may mean a firm’s stock is currently undervalued based on its revenues. In contrast, a higher than the industry average P/S may mean the stock is overvalued.
Free Cash Flow and Its Importance to Investors
FCF is the amount of cash a company earns, excluding amounts used to invest in fixed assets. This metric is relevant because it reveals the amount of cash that is free to distribute to shareholders to pay back debts or invest in the business. Free cash flow is one of the main values popular among investors for evaluating the company’s financial performance and ability to generate cash for shareholders. In general, the valuable positions regarding growth and return on investments are reserved for companies that dispose of a robust free cash flow ratio.
Using Multiple Metrics for Better Investment Decisions
Even though absolute numbers can tell a significant amount about a company, ratios can be useful when combined. Evaluating the P/E ratio and other factors such as EPS, dividend yield rate, and the DE ratio will help investors gain more insight into the stock’s value and growth prospects. The advantage of diversifying the analysis is eliminating other biases, such as placing too much emphasis on one measure.
Conclusion
It is crucial to evaluate factors such as P/E ratios and other stock metrics for the stock to be considered. They all reveal a certain amount of information about the company and its prospects regarding its financial standing and worth. By determining these indicators, any investor who cares to undertake such a noble venture will have higher prospects of success in the system. Whether one relies on the P/E ratio, dividend yield or free cash flow, a more inclusive strategy for a better security selection would be more advisable.